柱状图 Sample详情
最后更新时间:2019年6月17日
柱状图通过柱形的高度来表现数据的大小,用于有至少一个类目轴或时间轴的直角坐标系上。用于显示一段时间内的数据变化或显示各项之间的比较情况。例如:不同产品季度或年销量对比、不同产品的资料数目等,应用较为广泛。具体实现方法如下:
1
与折线图实现方法一样,在xml布局中添加ChartView控件,在此不赘述。
2
根据实际需求选择合适的数据来源,可参考折线图此部分实现方法。
3
如果需要统计多项数据,就创建多个柱状图对象。
//创建图表数据序列
List<Series> barSeriesLst = new ArrayList<Series>();
for (String key : map.keySet()) {
    //创建柱状图表
    BarSeries barSeries = new BarSeries();
    //创建图表数据
    List<Double> barDataLst = new ArrayList<Double>();
    //添加线数据到线数据列表
    for (Double d : map.get(key)) {
        barDataLst.add(d);
    }
    //设置数据
    barSeries.setDouleLst(barDataLst);
    //设置名称(必须设置)
    barSeries.setName(key);
    //设置柱条的宽度(单位像素)
    barSeries.setBarWidth(15f);
    //设置柱间距离(单位像素)
    barSeries.setBarGap(0);
    //设置图形高亮样式
    barSeries.setItemStyle(new ItemStyle().setEmphasis(new Emphasis().setColor(Color.rgb(190, 200, 191))));
    //添加图表数据
    barSeriesLst.add(barSeries);
}
4
与折线图类似,设置各项参数后即可显示柱状图。
Option mOption = new Option();
Title title = new Title();
title.setText("武汉市人口数大于550000的区_柱状图");
title.setAlignType(AlignType.center);
TextStyle textStyle = new TextStyle();
textStyle.setFontSize(14);
textStyle.setColor(Color.argb(1, 47, 69, 84));
title.setTextStyle(textStyle);
mOption.setTitle(title);
Tooltip tooltip = new Tooltip();
tooltip.setTrigger(TriggerType.item);
mOption.setTooltip(tooltip);
Legend legend = new Legend();
//设置是否显示
legend.setShow(true);
//设置组件的位置(左、上、右、下)
legend.setPosition(0.3f, 0.1f, 0.3f, 0.1f);
//设置布局方式,默认为水平布局,可选为:'horizontal' | 'vertical'
legend.setOrient(OrientType.horizontal);
//设置图例图形宽度 单位px
legend.setItemWidth(25);
//设置主副标题纵向间隔,单位px
legend.setItemGap(20);
//设置文本样式
legend.setTextStyle(new TextStyle().setFontSize(9));
//设置图例
mOption.setLegend(legend);
List<DataZoom> dataZoomLst = new ArrayList<DataZoom>();
//创建缩放区域
DataZoom dataZoom = new DataZoom();
//设置缩放类型,起始百分比和结束百分比
dataZoom.setStart(10).setEnd(100).setType(DataZoomType.inside);
//将缩放区域对象添加到缩放区域列表
dataZoomLst.add(dataZoom);
//设置数据区域缩放
mOption.setDataZoom(dataZoomLst);
CategoryAxis categoryAxis = new CategoryAxis();
//设置类目轴数据
categoryAxis.setStrLst(provinceName);
//设置是否显示
categoryAxis.setShow(true);
//设置坐标轴名称
categoryAxis.setName("区");
//创建X轴系列
List<Axis> xAxisLst = new ArrayList<Axis>();
xAxisLst.add(categoryAxis);
//设置X轴系列
mOption.setxAxis(xAxisLst);
ValueAxis yValueAxis = new ValueAxis();
//设置是否显示
yValueAxis.setShow(true);
//设置坐标轴类型;
yValueAxis.setType(AxisType.value);
//设置坐标轴名称
yValueAxis.setName("人口数/万");
//分割段数
yValueAxis.setSplitNumber(5);
//设置坐标轴名称与轴线之间的距离
yValueAxis.setNameGap(8);
//创建Y轴系列
List<Axis> yAxis = new ArrayList<Axis>();
yAxis.add(yValueAxis);
//设置Y轴系列
mOption.setyAxis(yAxis);
//得到多条柱状图的系列
mOption.setSeriesLst(barSeriesLst);
mChartView.setOption(mOption);
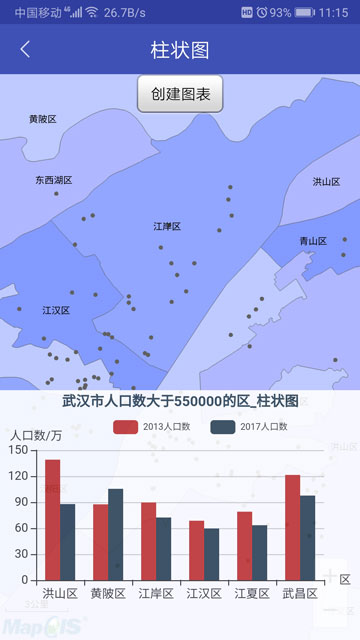
显示效果如下图所示: